|
AirControl
1.3.0
Open Source, Modular, and Extensible Flight Simulator For Deep Learning Research
|
|
AirControl
1.3.0
Open Source, Modular, and Extensible Flight Simulator For Deep Learning Research
|
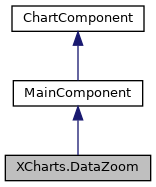
DataZoom component is used for zooming a specific area, which enables user to investigate data in detail, or get an overview of the data, or get rid of outlier points. More...
Public Types | |
| enum | FilterMode { FilterMode.Filter, FilterMode.WeakFilter, FilterMode.Empty, FilterMode.None } |
| Generally dataZoom component zoom or roam coordinate system through data filtering and set the windows of axes internally. Its behaviours vary according to filtering mode settings. More... | |
| enum | RangeMode { RangeMode.Percent } |
| The value type of start and end.取值类型 More... | |
Public Member Functions | |
| bool | IsInZoom (Vector2 pos) |
| 给定的坐标是否在缩放区域内 More... | |
| bool | IsInSelectedZoom (Vector2 pos) |
| 给定的坐标是否在选中区域内 More... | |
| bool | IsInSelectedZoom (int totalIndex, int index, bool invert) |
| bool | IsInStartZoom (Vector2 pos) |
| 给定的坐标是否在开始活动条触发区域内 More... | |
| bool | IsInEndZoom (Vector2 pos) |
| 给定的坐标是否在结束活动条触发区域内 More... | |
| bool | IsContainsAxis (Axis axis) |
| bool | IsContainsXAxis (int index) |
| bool | IsContainsYAxis (int index) |
| Color32 | GetFillerColor (Color32 themeColor) |
| Color32 | GetBackgroundColor (Color32 themeColor) |
| Color32 | GetBorderColor (Color32 themeColor) |
 Public Member Functions inherited from XCharts.ChartComponent Public Member Functions inherited from XCharts.ChartComponent | |
| virtual void | SetVerticesDirty () |
| virtual void | ClearVerticesDirty () |
| virtual void | SetComponentDirty () |
| virtual void | ClearComponentDirty () |
| virtual void | ClearDirty () |
| virtual void | SetAllDirty () |
Protected Attributes | |
| Color32 | m_FillerColor |
| Color32 | m_BorderColor |
| float | m_BorderWidth |
| Color32 | m_BackgroundColor |
| Protected Attributes inherited from XCharts.ChartComponent | |
| bool | m_VertsDirty |
| bool | m_ComponentDirty |
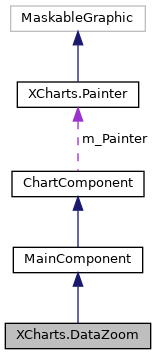
| Painter | m_Painter |
Properties | |
| bool | enable [get, set] |
| Whether to show dataZoom. 是否显示缩放区域。 More... | |
| FilterMode | filterMode [get, set] |
| The mode of data filter. 数据过滤类型。 More... | |
| List< int > | xAxisIndexs [get, set] |
| Specify which xAxis is controlled by the dataZoom. 控制的 x 轴索引列表。 More... | |
| List< int > | yAxisIndexs [get, set] |
| Specify which yAxis is controlled by the dataZoom. 控制的 y 轴索引列表。 More... | |
| bool | supportInside [get, set] |
| Whether built-in support is supported. Built into the coordinate system to allow the user to zoom in and out of the coordinate system by mouse dragging, mouse wheel, finger swiping (on the touch screen). More... | |
| bool | supportInsideScroll [get, set] |
| 是否支持坐标系内滚动 More... | |
| bool | supportInsideDrag [get, set] |
| 是否支持坐标系内拖拽 More... | |
| bool | supportSlider [get, set] |
| Whether a slider is supported. There are separate sliders on which the user zooms or roams. 是否支持滑动条。有单独的滑动条,用户在滑动条上进行缩放或漫游。 More... | |
| bool | showDataShadow [get, set] |
| Whether to show data shadow, to indicate the data tendency in brief. default:true 是否显示数据阴影。数据阴影可以简单地反应数据走势。 More... | |
| bool | showDetail [get, set] |
| Whether to show detail, that is, show the detailed data information when dragging. 是否显示detail,即拖拽时候显示详细数值信息。 [default: false] More... | |
| bool | zoomLock [get, set] |
| Specify whether to lock the size of window (selected area). default:false 是否锁定选择区域(或叫做数据窗口)的大小。 如果设置为 true 则锁定选择区域的大小,也就是说,只能平移,不能缩放。 More... | |
| bool | realtime [get] |
| Whether to show data shadow in dataZoom-silder component, to indicate the data tendency in brief. default:true 拖动时,是否实时更新系列的视图。如果设置为 false,则只在拖拽结束的时候更新。默认为true,暂不支持修改。 More... | |
| Color | backgroundColor [get, set] |
| The background color of the component. 组件的背景颜色。 More... | |
| Color32 | fillerColor [get, set] |
| the color of dataZoom data area. 数据区域颜色。 More... | |
| Color32 | borderColor [get, set] |
| the color of dataZoom border. 边框颜色。 More... | |
| float | borderWidth [get, set] |
| 边框宽。 More... | |
| float | bottom [get, set] |
| Distance between dataZoom component and the bottom side of the container. bottom value is a instant pixel value like 10 or float value [0-1]. default:10 组件离容器下侧的距离。 More... | |
| float | top [get, set] |
| Distance between dataZoom component and the top side of the container. top value is a instant pixel value like 10 or float value [0-1]. default:10 组件离容器上侧的距离。 More... | |
| float | left [get, set] |
| Distance between dataZoom component and the left side of the container. left value is a instant pixel value like 10 or float value [0-1]. default:10 组件离容器左侧的距离。 More... | |
| float | right [get, set] |
| Distance between dataZoom component and the right side of the container. right value is a instant pixel value like 10 or float value [0-1]. default:10 组件离容器右侧的距离。 More... | |
| RangeMode | rangeMode [get, set] |
| Use absolute value or percent value in DataZoom.start and DataZoom.end. default:RangeMode.Percent. 取绝对值还是百分比。 More... | |
| float | start [get, set] |
| The start percentage of the window out of the data extent, in the range of 0 ~ 100. [default:30]. 数据窗口范围的起始百分比。范围是:0 ~ 100。 More... | |
| float | end [get, set] |
| The end percentage of the window out of the data extent, in the range of 0 ~ 100. default:70 数据窗口范围的结束百分比。范围是:0 ~ 100。 More... | |
| int | minShowNum [get, set] |
| Minimum number of display data. Minimum number of data displayed when DataZoom is enlarged to maximum. 最小显示数据个数。当DataZoom放大到最大时,最小显示的数据个数。 More... | |
| float | scrollSensitivity [get, set] |
| The sensitivity of dataZoom scroll. The larger the number, the more sensitive it is. default:10 缩放区域组件的敏感度。值越高每次缩放所代表的数据越多。 More... | |
| Orient | orient [get, set] |
| Specify whether the layout of dataZoom component is horizontal or vertical. What's more, it indicates whether the horizontal axis or vertical axis is controlled by default in catesian coordinate system. 布局方式是横还是竖。不仅是布局方式,对于直角坐标系而言,也决定了,缺省情况控制横向数轴还是纵向数轴。 More... | |
| TextStyle | textStyle [get, set] |
| font style. 文字格式。 More... | |
| LineStyle | lineStyle [get, set] |
| 阴影线条样式。 More... | |
| AreaStyle | areaStyle [get, set] |
| 阴影填充样式。 More... | |
| int | index [get, set] |
| float | runtimeX [get] |
| float | runtimeY [get] |
| float | runtimeWidth [get] |
| float | runtimeHeight [get] |
| bool | runtimeDrag [get, set] |
| bool | runtimeCoordinateDrag [get, set] |
| bool | runtimeStartDrag [get, set] |
| bool | runtimeEndDrag [get, set] |
| double | runtimeStartValue [get, set] |
| 运行时实际范围的开始值 More... | |
| double | runtimeEndValue [get, set] |
| 运行时实际范围的结束值 More... | |
| bool | runtimeInvert [get, set] |
| static DataZoom | defaultDataZoom [get] |
| Properties inherited from XCharts.ChartComponent | |
| virtual bool | vertsDirty [get] |
| 图表重绘标记。 More... | |
| virtual bool | componentDirty [get] |
| 组件重新初始化标记。 More... | |
| bool | anyDirty [get] |
| 需要重绘图表或重新初始化组件。 More... | |
| Painter | painter [get, set] |
| Action | refreshComponent [get, set] |
| GameObject | gameObject [get, set] |
DataZoom component is used for zooming a specific area, which enables user to investigate data in detail, or get an overview of the data, or get rid of outlier points.
DataZoom 组件 用于区域缩放,从而能自由关注细节的数据信息,或者概览数据整体,或者去除离群点的影响。
Definition at line 24 of file DataZoom.cs.
|
strong |
Generally dataZoom component zoom or roam coordinate system through data filtering and set the windows of axes internally. Its behaviours vary according to filtering mode settings.
dataZoom 的运行原理是通过 数据过滤 来达到 数据窗口缩放 的效果。数据过滤模式的设置不同,效果也不同。
Definition at line 33 of file DataZoom.cs.
|
strong |
The value type of start and end.取值类型
| Enumerator | |
|---|---|
| Percent | percent value. 百分比 |
Definition at line 64 of file DataZoom.cs.
|
inline |
|
inline |
|
inline |
|
inline |
|
getset |
阴影填充样式。
Definition at line 387 of file DataZoom.cs.
|
getset |
The background color of the component. 组件的背景颜色。
Definition at line 229 of file DataZoom.cs.
|
getset |
the color of dataZoom border. 边框颜色。
Definition at line 248 of file DataZoom.cs.
|
getset |
边框宽。
Definition at line 256 of file DataZoom.cs.
|
getset |
Distance between dataZoom component and the bottom side of the container. bottom value is a instant pixel value like 10 or float value [0-1]. default:10 组件离容器下侧的距离。
Definition at line 267 of file DataZoom.cs.
|
getset |
Whether to show dataZoom. 是否显示缩放区域。
Definition at line 111 of file DataZoom.cs.
|
getset |
The end percentage of the window out of the data extent, in the range of 0 ~ 100. default:70 数据窗口范围的结束百分比。范围是:0 ~ 100。
Definition at line 330 of file DataZoom.cs.
|
getset |
the color of dataZoom data area. 数据区域颜色。
Definition at line 238 of file DataZoom.cs.
|
getset |
The mode of data filter. 数据过滤类型。
Definition at line 120 of file DataZoom.cs.
|
getset |
Distance between dataZoom component and the left side of the container. left value is a instant pixel value like 10 or float value [0-1]. default:10 组件离容器左侧的距离。
Definition at line 289 of file DataZoom.cs.
|
getset |
阴影线条样式。
Definition at line 379 of file DataZoom.cs.
|
getset |
Minimum number of display data. Minimum number of data displayed when DataZoom is enlarged to maximum. 最小显示数据个数。当DataZoom放大到最大时,最小显示的数据个数。
Definition at line 339 of file DataZoom.cs.
|
getset |
Specify whether the layout of dataZoom component is horizontal or vertical. What's more, it indicates whether the horizontal axis or vertical axis is controlled by default in catesian coordinate system. 布局方式是横还是竖。不仅是布局方式,对于直角坐标系而言,也决定了,缺省情况控制横向数轴还是纵向数轴。
Definition at line 362 of file DataZoom.cs.
|
getset |
Use absolute value or percent value in DataZoom.start and DataZoom.end. default:RangeMode.Percent. 取绝对值还是百分比。
Definition at line 310 of file DataZoom.cs.
|
get |
Whether to show data shadow in dataZoom-silder component, to indicate the data tendency in brief. default:true 拖动时,是否实时更新系列的视图。如果设置为 false,则只在拖拽结束的时候更新。默认为true,暂不支持修改。
Definition at line 223 of file DataZoom.cs.
|
getset |
Distance between dataZoom component and the right side of the container. right value is a instant pixel value like 10 or float value [0-1]. default:10 组件离容器右侧的距离。
Definition at line 300 of file DataZoom.cs.
|
getset |
|
getset |
|
getset |
The sensitivity of dataZoom scroll. The larger the number, the more sensitive it is. default:10 缩放区域组件的敏感度。值越高每次缩放所代表的数据越多。
Definition at line 350 of file DataZoom.cs.
|
getset |
Whether to show data shadow, to indicate the data tendency in brief. default:true 是否显示数据阴影。数据阴影可以简单地反应数据走势。
Definition at line 193 of file DataZoom.cs.
|
getset |
Whether to show detail, that is, show the detailed data information when dragging. 是否显示detail,即拖拽时候显示详细数值信息。 [default: false]
Definition at line 203 of file DataZoom.cs.
|
getset |
The start percentage of the window out of the data extent, in the range of 0 ~ 100. [default:30]. 数据窗口范围的起始百分比。范围是:0 ~ 100。
Definition at line 320 of file DataZoom.cs.
|
getset |
Whether built-in support is supported. Built into the coordinate system to allow the user to zoom in and out of the coordinate system by mouse dragging, mouse wheel, finger swiping (on the touch screen).
是否支持内置。内置于坐标系中,使用户可以在坐标系上通过鼠标拖拽、鼠标滚轮、手指滑动(触屏上)来缩放或漫游坐标系。
Definition at line 150 of file DataZoom.cs.
|
getset |
是否支持坐标系内拖拽
Definition at line 166 of file DataZoom.cs.
|
getset |
是否支持坐标系内滚动
Definition at line 158 of file DataZoom.cs.
|
getset |
Whether a slider is supported. There are separate sliders on which the user zooms or roams. 是否支持滑动条。有单独的滑动条,用户在滑动条上进行缩放或漫游。
Definition at line 175 of file DataZoom.cs.
|
getset |
font style. 文字格式。
Definition at line 371 of file DataZoom.cs.
|
getset |
Distance between dataZoom component and the top side of the container. top value is a instant pixel value like 10 or float value [0-1]. default:10 组件离容器上侧的距离。
Definition at line 278 of file DataZoom.cs.
|
getset |
Specify which xAxis is controlled by the dataZoom. 控制的 x 轴索引列表。
Definition at line 129 of file DataZoom.cs.
|
getset |
Specify which yAxis is controlled by the dataZoom. 控制的 y 轴索引列表。
Definition at line 138 of file DataZoom.cs.
|
getset |
Specify whether to lock the size of window (selected area). default:false 是否锁定选择区域(或叫做数据窗口)的大小。 如果设置为 true 则锁定选择区域的大小,也就是说,只能平移,不能缩放。
Definition at line 214 of file DataZoom.cs.